
Substation Reliability Tip #07
Data Visualization Helps Provide Valuable Insight into the Health of Your Electrical Equipment
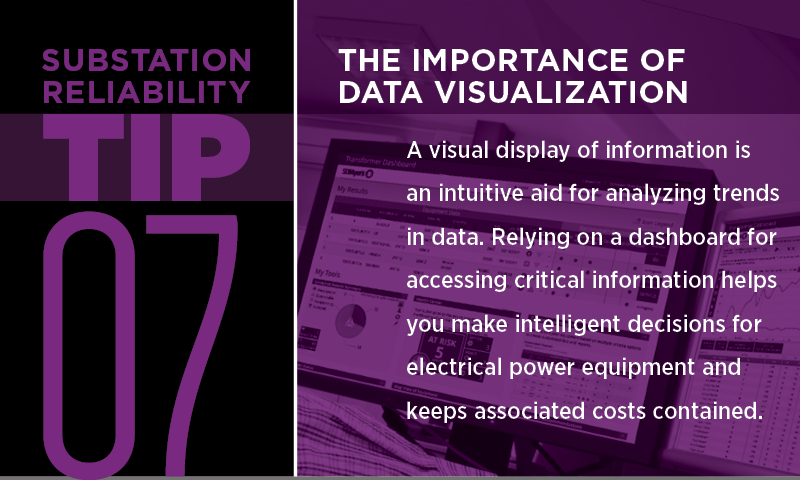
Data visualization plays a crucial role in monitoring the health of electrical equipment by presenting complex data in a visual format that is easily understandable and actionable.
A visual display of information—like a dashboard—can be an intuitive aid for analyzing trends in data. Visualizing historical test data for your transformer fleet enables you to analyze trends, which is essential for predictive or condition-based maintenance. Relying on a dashboard for accessing this critical information helps provide insight to make intelligent decisions for electrical power equipment, keeps maintenance costs low, and prevents unplanned downtime.
Your transformer dashboard at SDMyers acts like a mission control center—giving you valuable context for your data. It tells a story about your equipment and its health. By harnessing the power of data visualization, you make informed decisions, minimize downtime, reduce costs, and maximize the reliability and longevity of your electric power equipment.


 Please wait while logging in.