


What Does Particle Count Distribution Reveal About LTC Condition?
- Knowledge Center
- Articles
- Load Tap Changer
- What Does Particle Count Distribution Reveal About LTC Condition?
This article is Part 4 of a seven-part series on testing insulating liquids in load tap changers. Part 3 addressed liquid screen tests, moisture analysis, and DGA as routine LTC monitoring tools. Here we will address particle count distribution analysis — what it measures, how results are evaluated, and what elevated particle counts indicate about LTC operating condition. In Part 5, we will cover analytical ferrography.
Particle count distribution is a critical diagnostic complement to the liquid screen, moisture, and DGA suite. Where DGA and liquid screen tests evaluate chemical and thermal conditions in the oil, particle count distribution quantifies the physical product of those conditions — the suspended particles generated by normal and abnormal LTC operation. Elevated particle counts, particularly in larger size ranges, are among the most direct indicators of advancing film formation and abnormal mechanical or electrical activity within the device.
Test Method and Reporting
Particle count distribution is performed in accordance with ASTM D6786, Standard Test Method for Particle Count in Mineral Insulating Oil Using Automatic Optical Particle Counters. An automatic optical particle counter analyzes a test specimen, counts particles, and assigns them to standardized size bins. Results are reported as particles per milliliter (particles/mL) for each size range. Legacy methods that reported results per 10 mL or 100 mL must be normalized before comparing historical data against current results.
ISO 4406 Rating System
Results are also characterized using the ISO 4406 rating system, which assigns a three-value code based on particle concentrations in the >4 µm, >6 µm, and >14 µm size ranges. Although ISO 4406 was developed for lubricating oil applications, it is readily adapted for insulating oil use and is referenced within ASTM D6786.
Interpreting Size Distribution
Size distribution interpretation for LTCs is more nuanced than a simple total count threshold. Elevated values in the >4 µm range alone are generally of limited concern if the >6 µm and >14 µm values remain within acceptable ranges. Conversely, elevated values in the larger size ranges — particularly >23 µm and >50 µm — are of greater operational concern. Upward trends across successive sample intervals, particularly in the larger size ranges, are significant independent of absolute values.
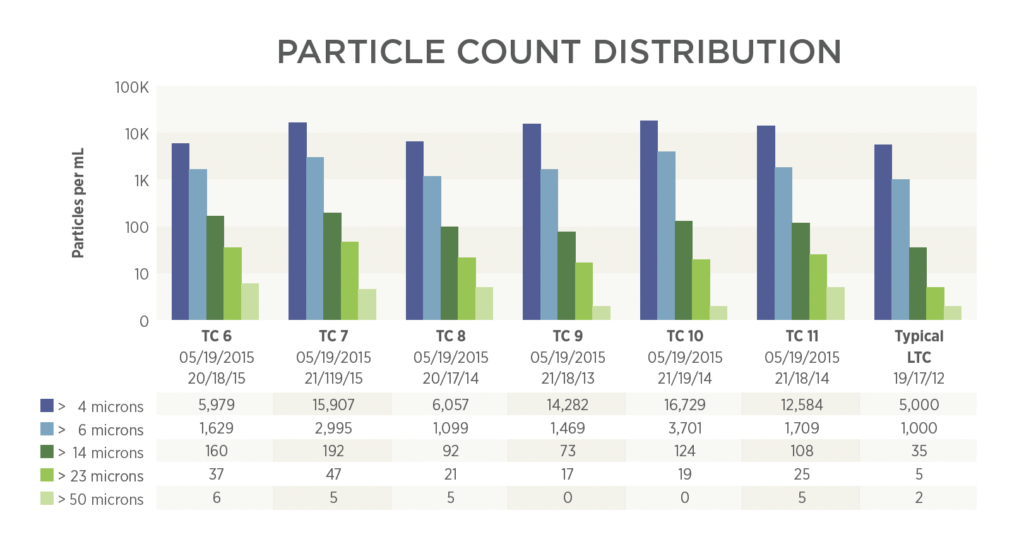
Particle count distribution results graphic showing sample data from six LTCs with ISO 4406 ratings and typical/acceptable distribution reference column.
Sources of Particles in LTC Oil
The dominant source of suspended particles in LTC oil is film. As film accumulates on contact surfaces, normal operation wipes it off and releases it as small particles into the oil, where it remains suspended until it is reincorporated into new film. Carbon particles generated by arcing during tap changes represent a second significant source. Under normal operating conditions, both film and carbon particles are small and concentrate primarily in the >4 µm and >6 µm bins without driving those values excessively high. As filming advances or tap change frequency increases, values in all size ranges rise, with a disproportionate increase in the larger bins reflecting the generation of larger film fragments.
Severity Classification
In the absence of broadly adopted industry standards for LTC particle count values, laboratory-specific databases and field-correlated experience are used to establish acceptable, elevated, high, very high, and (rarely) extremely high classifications for each size range. Extremely high values for the larger size ranges represent a serious hazard, as they can indicate mechanical binding conditions within the device.
Summary:
- ASTM D6786 governs particle count distribution testing; results are reported as particles/mL per size range and rated using ISO 4406 coding.
- Larger size ranges (>23 µm, >50 µm) carry greater diagnostic weight than the smaller bins; upward trends across sample intervals are independently significant.
- Small particles (4 µm, >6 µm) dominate under normal LTC operation; disproportionate increases in larger size ranges indicate advancing film formation or abnormal mechanical activity.
- No broadly established industry standard for LTC particle count thresholds currently exists; laboratory databases derived from correlated field inspection data serve as the primary reference.
- Extremely high particle counts in larger size ranges represent a hazard of mechanical failure and warrant expedited maintenance.
In This Series:
- Part 1: How Does Mineral Oil Age Inside a Load Tap Changer?
- Part 2: What Causes Accelerated Film Formation in LTCs?
- Part 3: How Are Liquid Screen, Moisture, and DGA Used to Monitor LTCs?
- Part 4: What Does Particle Count Distribution Reveal About LTC Condition?
- Part 5: What Can Analytical Ferrography Reveal About LTC Particle Sources?
- Part 6: How Is Particle Count Analysis Applied to Other Oil-Filled Equipment?
- Part 7: What Standards and Case Studies Define LTC Particle Analysis?